By Josh Chang
This article refers to Josh Chang’s 2020 presidential election model, featured under the “Model” tab on the Paw Print 2020 Election page.
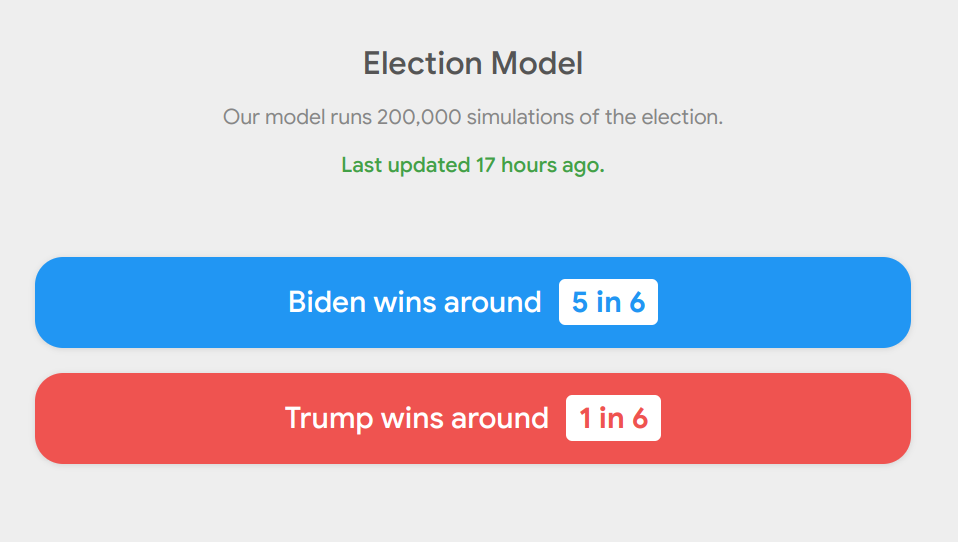
Presidential elections are endlessly complex. So, when my 2020 election model gives Joe Biden a five in six chance of winning, how does it come up with that probability?
In broad terms, my model is a computer program that runs a ton of realistic, random simulations of the election. When it is done, it records what proportion of those simulations each candidate won. That’s their chance of winning the election.
The first step the model completes, even before any simulations are run, is the calculation of polling averages for each state and the nation at large. The model does this by first downloading a live database of individual polls from FiveThirtyEight. The model then averages the results of these polls in an intentionally unequal way; polls that are more recent, have greater sample sizes, or are conducted by pollsters with better track records are given higher weights. Additionally, polls are adjusted for the past partisan lean of the pollster who conducted them.
Once the weighted adjusted polls are averaged together, the model slightly tweaks those averages based on the past voting patterns of a state compared to the national environment, especially for states which have little or no quality polling. For example, since Michigan voted about two points more Republican than the popular vote in 2016, the model would guess Michigan might be two points more Republican than the 2020 national polling average at any given moment. That happens to be a pretty good guess right now based on current polling of Michigan and the country, which demonstrates how this tactic could be used effectively in states with very few polls, such as Wyoming or Vermont.
Once the model has calculated polling averages for each state, it then uses them to ensure the simulations are realistic. But the model does not blatantly “believe” the polls. Instead, the model tries to account for all the ways the polls could be off. In each simulation, the model generates random deviations from the polling averages for each state, each region, and the nation as a whole.
These deviations are equally likely to benefit Democrats or Republicans, but the degree of the deviation is based on historical data. Essentially, if polls historically have been off by a certain amount on average, then half of the deviations in the simulations will be greater and half less than that average. The model also assumes more uncertainty (greater deviations from the polling) the farther it is from election day and in states with less polling.
The final factor that the model uses is correlated errors based on the demographic composition of states. Basically, the results in states with similar demographics are likely to deviate from the polls in a similar ways. The way this works in the model is somewhat complex, but know that it does take this into account in a sophisticated way.
All this considered, I would argue that my model does a pretty careful job of quantifying uncertainty. I hope you enjoy the visuals and find it to be a useful tool when trying to understand the state of the race. And remember—things with a one in six chance do happen, but they usually don’t.

Be First to Comment